Services and Rentals Reporting Widgets in Dashboard and Custom Reports

HighLevel just made reporting a whole lot better for businesses that sell services, manage appointments, or handle rentals.
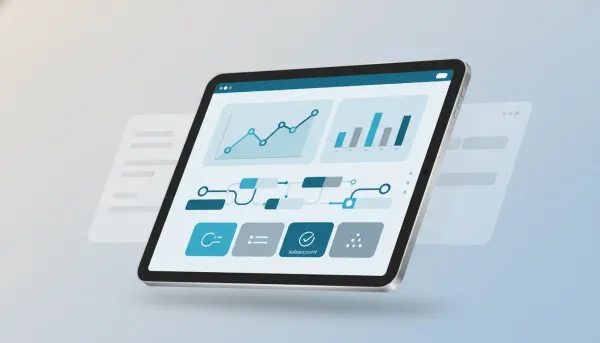
If you rely on dashboards to understand what is actually happening inside your CRM, this update matters. Service and rental reporting widgets are now live in both the dashboard and customer reports, which means you can track performance with a lot more precision without cobbling together workarounds.
This is one of those updates that looks simple on the surface, but once you start using it, it opens up a ton of flexibility. You can measure revenue, booking activity, category performance, order value, and booking status from multiple angles. On top of that, these widgets also tie into quick filters, custom dashboards, and custom metrics, so the reporting can match the way your business or agency actually operates.
For agencies running client accounts in GoHighLevel, and for businesses using HighLevel as the core operating system for CRM, marketing automation, and service operations, this gives you much better visibility into what is driving results.
The Complete Operating System for Growth
Join over 60,000+ agencies and businesses using HighLevel to capture more leads and close more deals. Start your trial today and get instant access to the Nexus Hub resources.
Claim Your Free Trial & BonusesWhat’s new in HighLevel reporting
The update introduces two major reporting sets:
- Service reporting widgets
- Rental reporting widgets
Each side comes with 11 individual widgets, giving you a broad set of data points to work with inside both dashboards and customer reports.
That means if your business model includes booked services, appointment-based offers, or rentals, you now have a much more complete way to monitor performance directly inside HighLevel.
Instead of relying on scattered numbers or separate spreadsheets, you can pull those insights into the same place where you already manage leads, opportunities, automations, communication, and operations.
Service reporting widgets: what you can track
On the services side, HighLevel now supports reporting widgets for key business metrics such as:
- Total revenue
- Revenue by service
- Revenue by category
- Average order value
Those are the headline examples, and they already tell a pretty important story.
Total revenue
Total revenue gives you the high-level snapshot. If you want to know how your service offerings are performing over a given period, this is the starting point.
For a single business, that helps answer the obvious question: how much money did services generate?
For an agency managing multiple client accounts, this becomes even more useful because you can use it as a fast health check for account performance and identify where deeper optimization is needed.
Revenue by service
Revenue by service helps you break performance down by offer. This matters because total revenue only tells you the outcome. Revenue by service tells you what is creating that outcome.
If one service is clearly outperforming the rest, that can influence:
- Offer positioning
- Marketing focus
- Pricing strategy
- Workflow automation priorities
- Sales follow-up processes
It also gives you a clearer sense of where to scale. In HighLevel agency setups, this kind of breakdown can help you make smarter recommendations to clients instead of speaking in generalities.
Revenue by category
Revenue by category adds another layer of visibility. Sometimes performance is not best understood at the individual service level. A category-level view can reveal broader patterns in demand.
That is useful if you group offers into buckets like consultations, recurring services, premium packages, or specialty work. Category reporting can help you identify where the business has momentum and where it may be overextended.
Average order value
Average order value is one of the most practical metrics in the whole set.
Why? Because growth does not always come from getting more bookings. Sometimes it comes from increasing the value of each booking. If average order value rises, your revenue can improve even if booking volume stays flat.
That makes this widget especially helpful when evaluating:
- Upsell strategies
- Bundled services
- Premium pricing
- Sales process effectiveness
Inside a platform like HighLevel, where automations and funnels often work alongside booking systems, this kind of reporting helps connect sales strategy to actual revenue results.
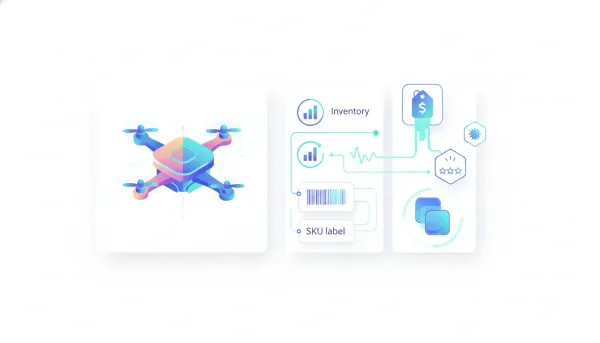
Rental reporting widgets: more clarity for booking-based businesses
The rental side gets its own set of 11 widgets, and these are designed to help track operational and revenue metrics specific to rentals.
Examples called out in the update include:
- Total rentals booked
- Booking status breakdown
- Total revenue excluding deposits
That mix is important because rental businesses often need to balance volume, status tracking, and true revenue recognition, not just gross numbers.
Total rentals booked
Total rentals booked gives you a direct count of activity. It answers the operational question of how much booking volume the business is handling.
That can be useful on its own, but it becomes much more powerful when viewed alongside revenue and status data. A large number of bookings does not automatically mean strong performance if those bookings are low value, pending, or not converting cleanly.
Booking status breakdown
Booking status breakdown adds context to the raw booking count.
This can help you understand the distribution of bookings across different statuses, which is a major operational advantage. If too many bookings are sitting in a non-finalized state, that can point to process issues, follow-up gaps, or friction in the customer journey.
For teams using HighLevel workflows and automations, this creates opportunities to tighten up the system. If status data shows a bottleneck, you can build or improve automations around reminders, confirmations, follow-ups, or internal alerts.
Total revenue excluding deposits
This is one of the smartest rental-specific metrics in the update.
Deposits can distort revenue visibility if they are counted the same way as completed rental revenue. By separating revenue excluding deposits, HighLevel gives businesses a clearer look at what has actually been earned beyond initial payment collection.
That makes reporting more useful for financial analysis and day-to-day decision making.
In practical terms, it helps answer questions like:
- How much real rental revenue has been generated?
- Are deposits making the business look healthier than it is?
- What does actual earned revenue look like over time?
Why this update matters beyond the widgets themselves
The real value here is not just that there are 22 new widgets across services and rentals.
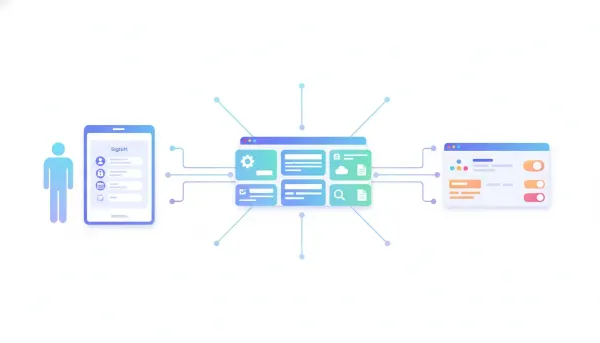
The bigger story is that these reporting options are integrated into the way HighLevel already works.
You are not dealing with a disconnected analytics add-on. These widgets live inside the dashboard and customer reports, and they also flow into the quick filters. That means the reporting is not static. You can shape it to fit what you actually need to analyze.
This flexibility matters for both internal teams and agencies.
For businesses
If you run a service-based or rental-based operation, you need to know more than just whether bookings are coming in. You need to know:
- Which offers generate the most revenue
- Which categories perform best
- Whether order value is increasing
- How rentals are progressing through statuses
- What revenue is real versus deposit-based
These widgets make that easier to access in one place.
For agencies
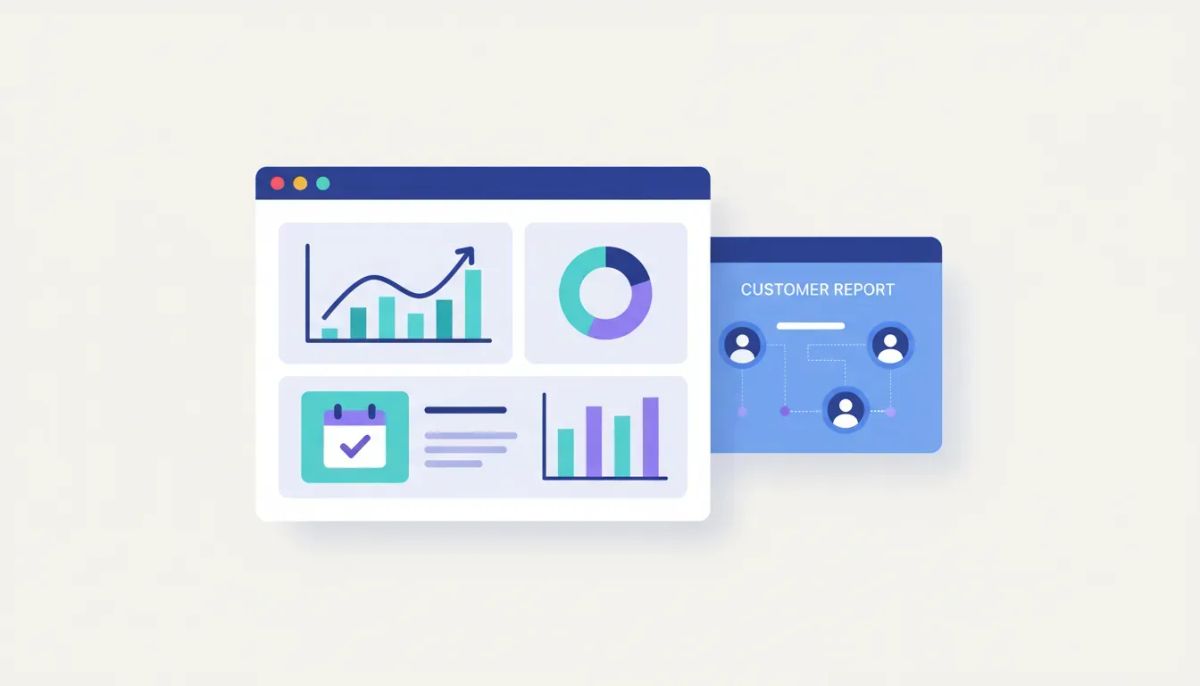
If you manage client reporting inside GoHighLevel, this update makes your reporting stack stronger.
You can build more useful customer reports, create better custom dashboards, and show clients metrics that connect directly to service and rental operations. That is a lot more meaningful than surface-level marketing numbers alone.
It also supports better agency systems. When you can standardize how reporting is presented across accounts, it becomes easier to scale, improve client communication, and identify optimization opportunities faster.
The Complete Operating System for Growth
Join over 60,000+ agencies and businesses using HighLevel to capture more leads and close more deals. Start your trial today and get instant access to the Nexus Hub resources.
Claim Your Free Trial & BonusesQuick filters make the reporting more usable
One of the most useful parts of this release is that all of these reporting elements make their way into quick filters.
That may sound like a small detail, but it changes how practical the feature is day to day.
Quick filters help you narrow the data and view the metrics that matter for a specific use case. Instead of being stuck with a single top-line view, you can filter different reporting widgets and shape the data presentation to match your goals.
This is particularly helpful when you need to answer very specific questions, compare time periods, or segment what you are reviewing.
In other words, you are not just getting more data. You are getting more control over how that data is surfaced.
Custom dashboards and custom metrics open up even more options
This update becomes especially powerful once you combine it with custom dashboards and custom metrics.
That means you are not limited to a default reporting layout. You can build dashboards around the KPIs that matter most to your business model or your clients.
For example, if service revenue is the key driver for one account and rental status management is the biggest pain point for another, you can reflect those priorities in the dashboard itself.
This kind of flexibility is exactly what makes HighLevel useful as a business operating platform rather than just another CRM. It lets you combine reporting, CRM data, and automations in a way that supports real implementation.
Some practical advantages of custom dashboards and metrics include:
- Highlighting the KPIs most relevant to a specific business model
- Reducing clutter by focusing only on the numbers that matter
- Creating cleaner customer reports for client-facing communication
- Building repeatable reporting templates across agency accounts
- Supporting better decision-making with more contextual visibility
How to think about implementation inside HighLevel
If you are using HighLevel seriously, the opportunity here is not just to turn the widgets on and move on. The smarter move is to think about how these reporting widgets fit into your larger system.
Start with the business model
Figure out whether services, rentals, or both are central to the account you are working on. Then identify the handful of metrics that actually indicate performance.
Not every widget needs to be front and center. The goal is useful reporting, not crowded reporting.
Match dashboards to decision-making
Build dashboards around the decisions that need to be made regularly.
If pricing, upsells, and offer mix are frequent conversations, service revenue and average order value deserve visibility. If fulfillment and booking progression are the bigger challenge, rental status and booking counts may need to take priority.
Use reporting to improve automations
Because HighLevel is also a marketing automation and operations platform, reporting should feed back into workflows.
If the metrics reveal weak spots, that is where workflows and automations come in. Better reminders, stronger follow-up, confirmation sequences, and internal task triggers can all support better outcomes when the data points to a bottleneck.
Standardize for scale
For agencies, consistency is huge.
If you can create a repeatable dashboard and reporting structure for service-based clients or rental-based clients, you make the account easier to manage and easier to explain. That is a meaningful step toward cleaner HighLevel agency setup and scaling.
Where to find help documentation
If you want the official support guidance, HighLevel has documentation available at help.gohighlevel.com.
The easiest way to find it is to search for:
- rental reporting widgets
- service reporting widgets
The support documentation is the best next stop if you want the exact feature references and setup details.
Why this is a strong addition to the HighLevel ecosystem
HighLevel keeps getting stronger when it comes to centralizing business operations.
Reporting is one of the areas where platforms either become truly useful or start to feel fragmented. When service and rental reporting live alongside CRM activity, customer records, automations, and dashboards, you get a much clearer operational picture.
That is important for anyone trying to run leaner systems, improve customer reporting, or manage SaaS operations across multiple accounts.
This update may sound like a reporting enhancement, but it really improves visibility across the whole account. Better visibility leads to better decisions, better implementation, and better optimization.
And that is what good reporting should do.
FAQ
What are the new reporting widgets in HighLevel?
HighLevel added new service reporting widgets and rental reporting widgets to both the dashboard and customer reports. There are 11 widgets for services and 11 for rentals.
Where can I use the service and rental reporting widgets?
You can use them in the dashboard and in customer reports. They also flow into quick filters, and they can be incorporated into custom dashboards and custom metrics.
What service metrics are included?
Examples include total revenue, revenue by service, revenue by category, and average order value.
What rental metrics are included?
Examples include total rentals booked, booking status breakdown, and total revenue excluding deposits.
Why is revenue excluding deposits useful for rental reporting?
It gives a clearer picture of earned revenue by separating deposit amounts from broader rental revenue, which helps with more accurate analysis.
Do these widgets support filtered reporting?
Yes. The new service and rental reporting data is available in quick filters, which allows you to tailor the reporting view more precisely.
Can agencies use these widgets in client reporting?
Yes. These widgets are especially useful for agencies using GoHighLevel to create clearer customer reports and more customized dashboards for service-based and rental-based clients.
Where can I find the HighLevel help docs for this feature?
Go to help.gohighlevel.com and search for rental reporting widgets or service reporting widgets.
Final thought
If your business depends on appointments, services, or rentals, this update gives you a lot more reporting depth where it counts. And if you are building in HighLevel at the agency level, it gives you more tools to create cleaner reporting systems that actually help clients understand performance.
That combination of visibility, filtering, and customization is what makes this release useful. There is a ton you can do with it.
If you are still getting your systems dialed in, this is a good time to explore a HighLevel free trial and see how the dashboard, custom reports, workflows, and reporting tools can fit together inside one platform. And if you want templates, implementation help, and a stronger path to setup and scale, joining the Nexus Hub community can be a smart next step.
The Complete Operating System for Growth
Join over 60,000+ agencies and businesses using HighLevel to capture more leads and close more deals. Start your trial today and get instant access to the Nexus Hub resources.
Claim Your Free Trial & Bonuses