
How to Access and Interpret WordPress Site Performance Reports in HighLevel (GoHighLevel)
Learn how to access and interpret WordPress performance reports in HighLevel. This guide covers Core Web Vitals, page health diagnostics, and actionable optimization steps to boost site speed and SEO rankings for agency clients. Enhance your site's performance today.


If you host WordPress sites inside HighLevel (GoHighLevel) or manage client sites from the platform, the built-in performance report is the fastest way to gather actionable speed, Core Web Vitals, and page health data in one place. This guide shows where to find the report, how to read the most important metrics, what to fix first, and practical steps agencies and site owners can use to improve performance and SEO.
What the HighLevel WordPress Performance Report Is and Why It Matters
The performance report available in HighLevel's WordPress management consolidates lab-style and diagnostic information into a single view for each site. It includes:
- Page speed scores for desktop and mobile
- Core Web Vitals measurements (LCP, interactivity, and visual stability metrics)
- Page health checks with a categorized list of issues to fix now, consider fixing, and items already passed
Why this matters: search engines use performance signals as ranking factors, and fast, stable pages convert better. For agencies running multiple WordPress sites in HighLevel, a centralized performance report saves time and creates a repeatable optimization workflow.
Quick: How to Open a Performance Report in HighLevel
Follow these steps inside your HighLevel account to fetch a performance report for a hosted WordPress site.
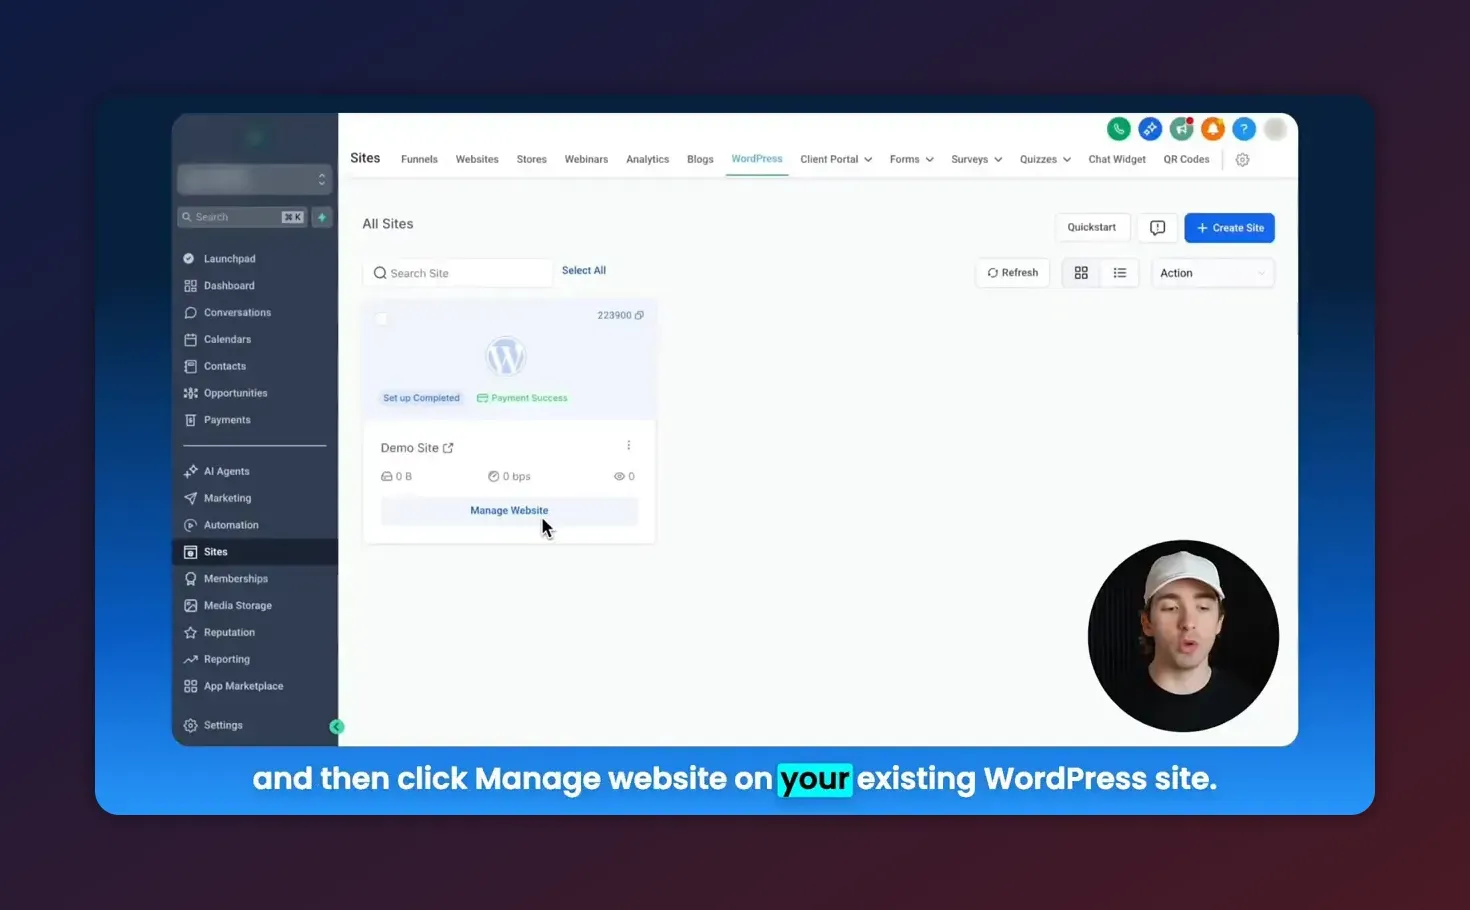
- Go to Sites, then choose WordPress.
- Click Manage Website for the site you want to analyze.
- Open the Analytics tab inside the site manager.
- Click Fetch Report or Generate Report to produce a current performance snapshot.
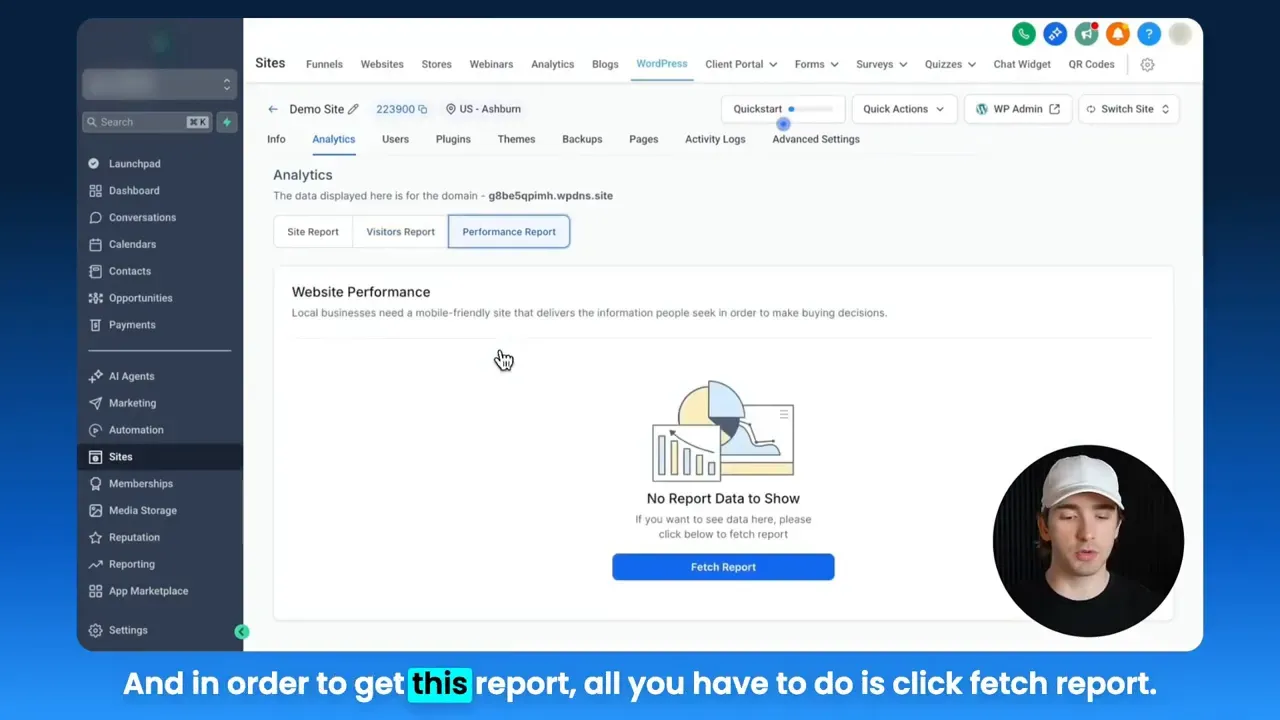
After fetching, the report populates page speed, Core Web Vitals, and page health sections for both desktop and mobile.
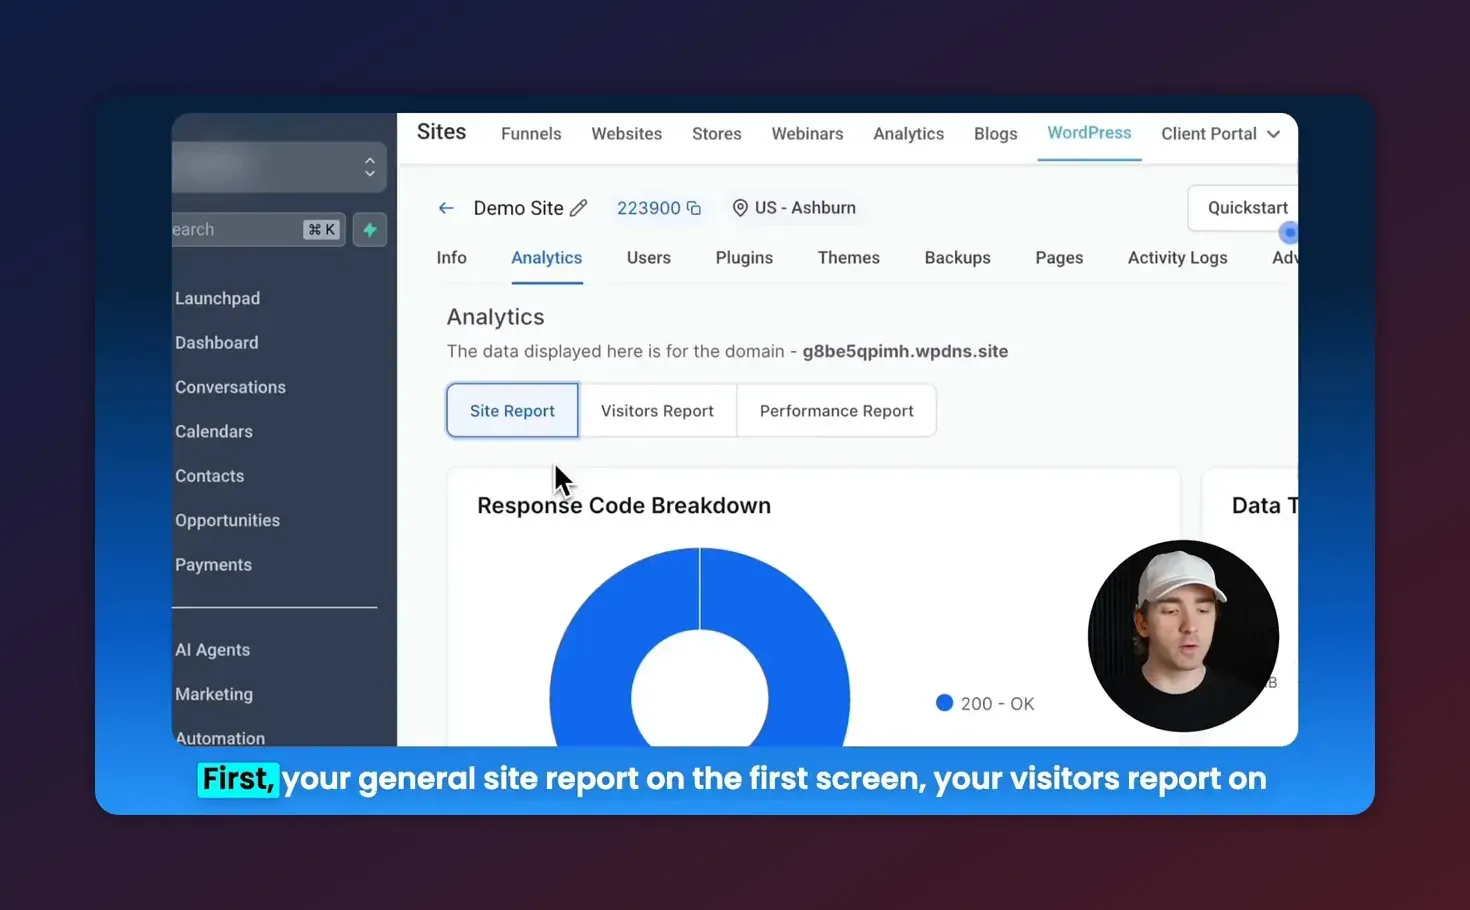
Understanding the Main Sections of the Report
Page speed scores
The report shows an overall score for desktop and mobile. These scores summarize multiple metrics used by page speed tools. Use the scores as quick indicators, but dig into the individual metrics for root causes.
Core Web Vitals
Core Web Vitals are the most critical user-centric metrics that Google highlights. The report maps these into easy-to-read categories:
- Largest Contentful Paint (LCP) - measures loading performance. Target: under 2.5 seconds
- Interactivity - historically First Input Delay (FID), now represented by metrics like Interaction to Next Paint or INP. Target: under 200 milliseconds
- Cumulative Layout Shift (CLS) - measures visual stability. Target: less than 0.1
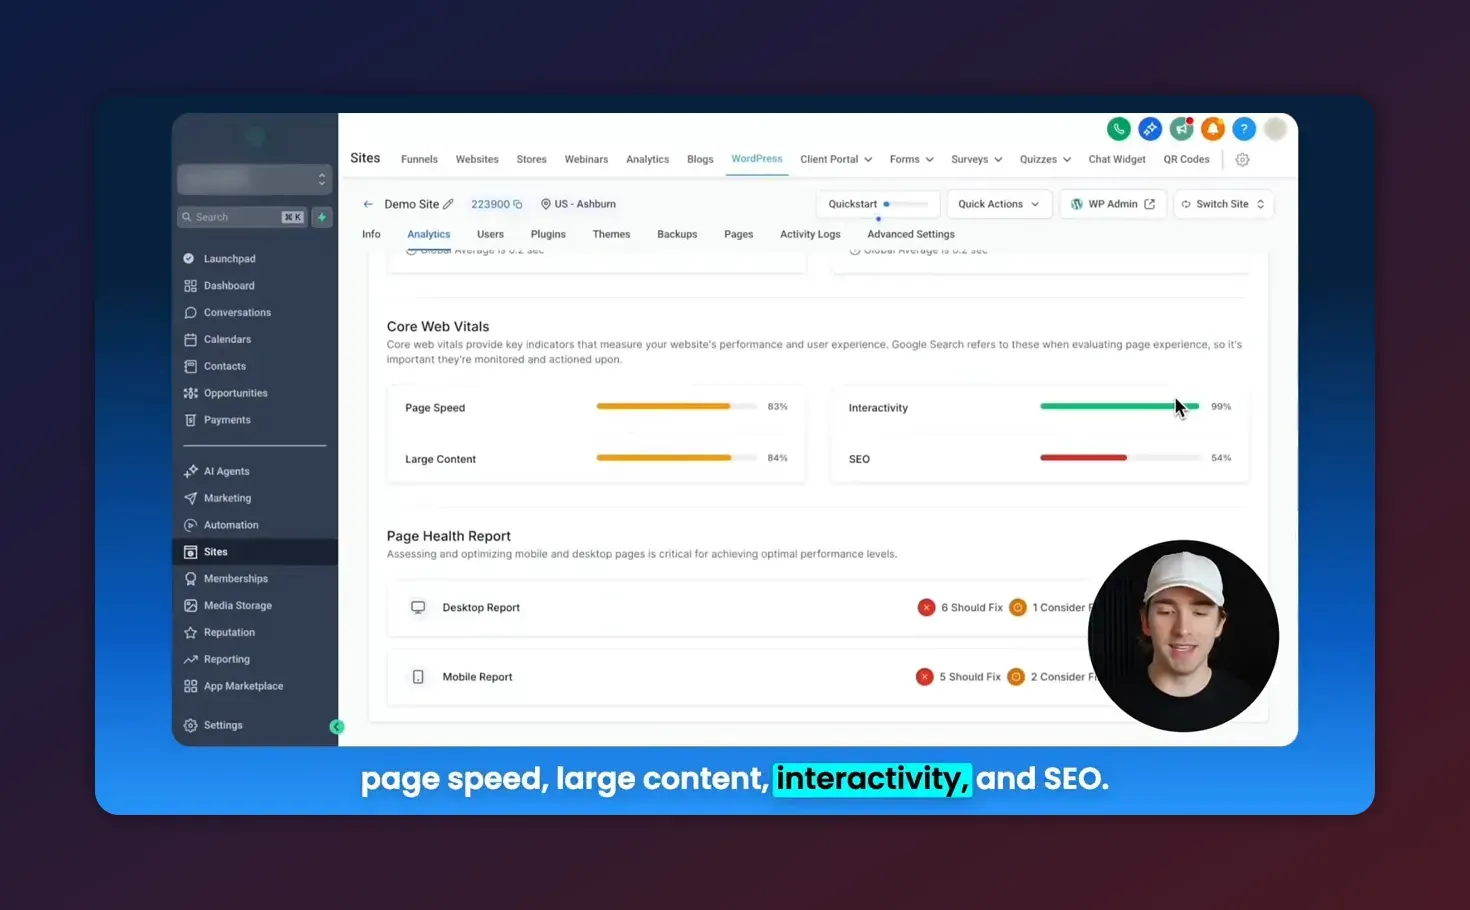
Page health report
This section breaks down specific technical issues and groups them into three buckets:
- Should be immediately fixed - high-impact problems such as blocking JavaScript or improperly sized images
- Should consider fixing - moderate impact items like long CSS files or unminified resources
- Passed - checks the site already meets
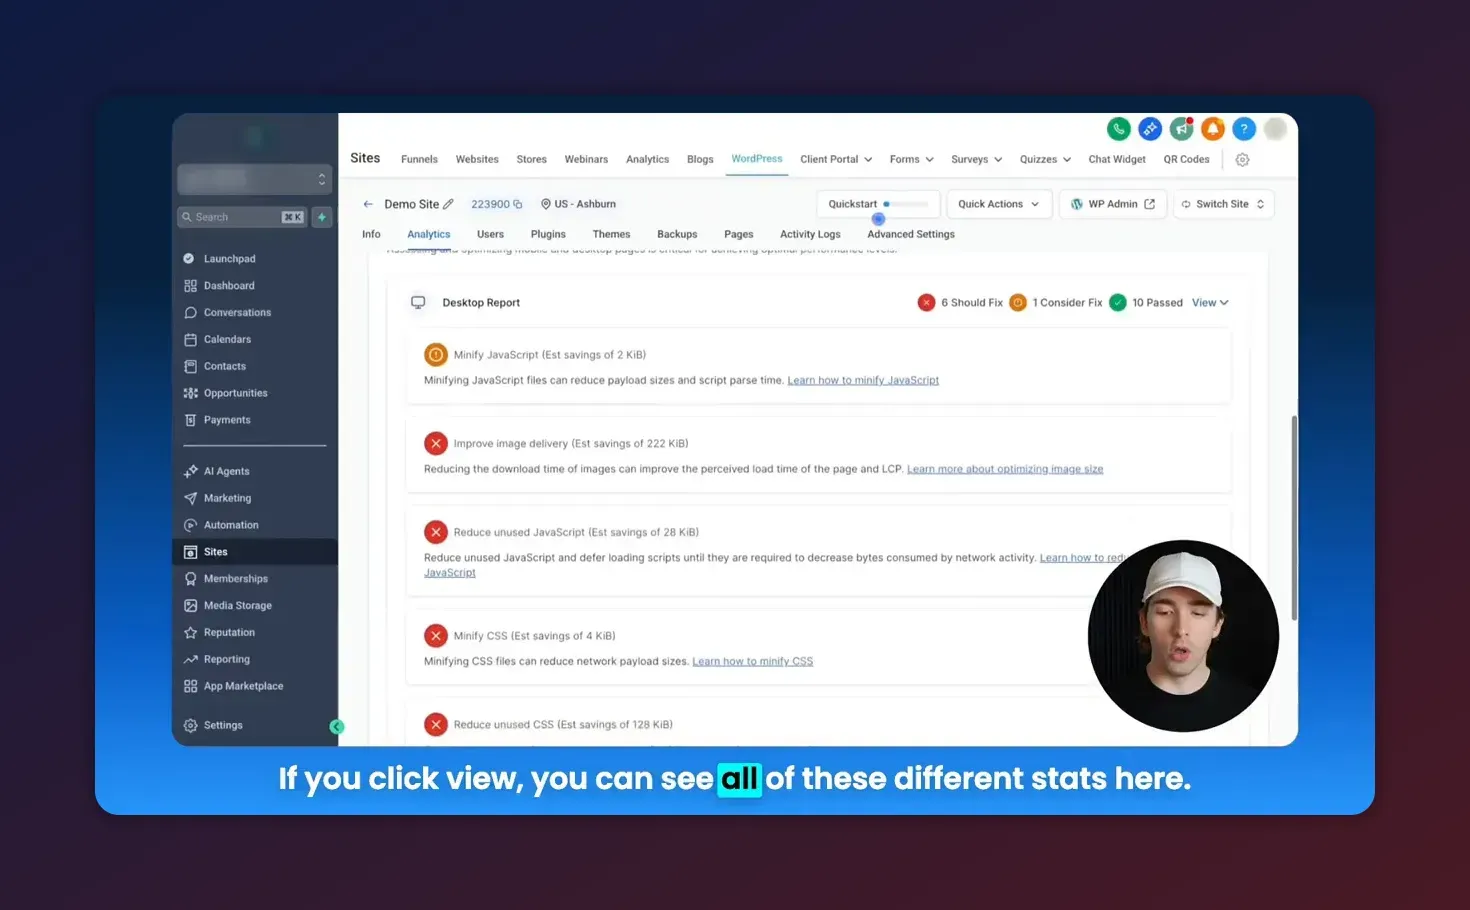
The page health view includes direct pointers to things like JavaScript usage, image delivery problems, CSS file bloat, unused CSS, and other optimization opportunities for both desktop and mobile.
How to Interpret Results: A Practical Checklist
When you open a report, use this practical checklist to prioritize fixes and verify improvements.
- Compare desktop vs mobile scores - mobile often underperforms due to network and device constraints. Identify large score gaps first.
- Check Core Web Vitals against thresholds - if LCP, INP, or CLS exceed targets, focus on that metric first.
- Review "Immediate fixes" list - these items usually yield the biggest gains with moderate effort.
- Note recurring offenders - large images, render-blocking CSS/JS, and third-party scripts often appear across sites.
- Record the baseline - take screenshots or export the report for comparison after changes.
Common Issues the Report Will Flag and How to Fix Them
Below are common page health items and practical fixes that match what the performance report typically highlights.
- Large images or wrong image formats
- Fix: Compress images, use next-gen formats (WebP or AVIF), and serve appropriately sized images via responsive srcsets.
- High impact: significant reductions in LCP and overall page weight.
- Render-blocking JavaScript and CSS
- Fix: Defer noncritical JS, async where possible, inline critical CSS, and load the remainder asynchronously.
- HighLevel context: use lightweight themes and minimize heavy page builder scripts when possible.
- Unused CSS
- Fix: Purge unused rules, generate critical CSS and combine/minify remaining files.
- Tools: build pipeline plugins, CSS purging tools, or theme optimizations.
- Excessive third-party scripts
- Fix: Remove nonessential widgets, lazy load analytics and chat scripts, or load them after user interaction.
- Note: Third-party tags can dramatically affect interactivity and LCP.
- No caching or missing CDN
- Fix: Enable server-side caching, add a CDN for static assets, and verify caching headers for images and scripts.
- HighLevel: confirm hosting and caching options available for WordPress sites hosted on the platform.
- Large DOM size or too many requests
- Fix: Simplify page structure, remove unused plugins, and combine resource files where possible.
Step-by-Step Optimization Workflow for Agencies Using HighLevel
Use this repeatable workflow to standardize performance improvements across client WordPress sites hosted in HighLevel.
- Baseline - Fetch a performance report and save screenshots for desktop and mobile.
- Prioritize - Create a priority list from the "immediate fixes" section. Aim to tackle the top 3-5 issues first.
- Plan - Map each issue to a specific fix, owner, and expected outcome. Example tasks: compress images, defer JS, purge CSS.
- Apply changes on a staging environment - test fixes before deploying to production to avoid breaking layouts or features.
- Deploy and clear caches - publish changes and purge all caches including CDN and server caches.
- Re-run the performance report - fetch a fresh report in HighLevel and compare to the baseline.
- Document results for the client - include before/after screenshots and a short explanation of the fixes applied.
Tip: Include a performance check as part of your onboarding or monthly maintenance package. You can also incorporate these steps into HighLevel automations or workflows to create tasks when certain thresholds are breached.
How Often to Run Performance Reports
- After every major update - theme changes, new plugins, or large content additions.
- Weekly or biweekly for high-traffic sites where small regressions matter.
- Monthly for most client sites as part of routine maintenance.
Consistency matters. Run the report before and after optimizations and keep a changelog to correlate performance improvements with specific changes.
Lab Data vs Real-World Field Data - Important Distinction
The performance report provides lab-style diagnostics and recommendations. Lab data is useful for reproducible tests but can differ from real-user metrics collected in the field. Use lab data to make targeted improvements, and rely on real-user monitoring tools for long-term trends and regression detection.
Start Your HighLevel Trial + Get Instant Nexus Hub Access
Build, scale, and optimize your business with HighLevel. Start a free trial using this link to get automatic access to the Nexus Hub community, templates, and implementation resources.
Start Free TrialCommon Mistakes and Pitfalls to Avoid
- Chasing a single score - a high PageSpeed score is helpful but not the full picture. Focus on Core Web Vitals and user experience improvements.
- Applying fixes without testing - CSS/JS changes can break site functionality. Always test in staging.
- Forgetting to clear caches - many reported problems persist after changes if caches are not purged.
- Over-optimizing at the cost of functionality - aggressive script removal can break forms, tracking, or client features.
- Relying only on automated fixes - automated optimization plugins help but sometimes require manual tuning for complex themes or page builders.
When to Escalate to Development
Some issues flagged by the performance report will require developer-level changes. Escalate tasks such as:
- Implementing server-side rendering or critical CSS generation
- Refactoring heavy theme templates that bloat the DOM
- Replacing or reengineering third-party integrations that badly affect interactivity
For agencies, include escalation criteria in your SOP so junior team members know when to open a dev ticket.
Example: Typical Before and After Fix Set
Here is a concise example of changes that commonly produce visible improvements in the report:
- Compress and convert images to WebP - smaller payload, faster LCP
- Defer noncritical third-party scripts - better interactivity metrics
- Generate critical CSS and lazy-load the rest - improved first render and CLS
- Enable server cache and add CDN - reduce Time to First Byte and network latency
Integrating HighLevel Performance Checks into Agency Systems
HighLevel is not just a hosting surface. Use platform features like CRM, workflows, and tasks to create operational systems around performance:
- Onboarding checklist item - fetch and save a performance report when taking on a new WordPress client.
- Monthly maintenance workflow - create an automated task to run a report and notify the account manager if metrics fall below thresholds.
- Client reporting - include before/after snapshots in monthly reports and explain what the numbers mean in plain language.
- Use Nexus Hub and templates - adopt performance audit templates from community resources to speed up audits and standardize fixes.
Troubleshooting: If Scores Don’t Improve
- Clear all caches and CDN after each change, then re-fetch the report.
- Verify testing location and throttling - mobile scores vary by network; consider testing from different regions.
- Check for plugin conflicts - disable recently added plugins and test again.
- Look for persistent third-party scripts that reload or inject heavy markup on page load.
- Measure real-user metrics with analytics plugins or RUM tools to see if lab improvements translate to users.
Final Checklist Before Marking a Job Done
- Document the original report and the new report side-by-side.
- Confirm Core Web Vitals meet target thresholds or improved significantly.
- Test critical site functionality: forms, checkout, tracking pixels.
- Clear caches and verify CDN delivery.
- Schedule a follow-up check in 2 to 4 weeks to catch regressions.
Frequently Asked Questions
How often should I fetch a performance report in HighLevel?
Fetch a report after any major update, and periodically based on site importance: weekly for high-traffic sites, monthly for most clients. Always fetch before and after optimization changes to compare results.
Does the performance report replace Google PageSpeed Insights or Lighthouse?
The HighLevel report consolidates similar lab data and makes it easy to access from the platform. It does not replace field data collection. Use PageSpeed Insights, Lighthouse, and real-user monitoring alongside the HighLevel report for a complete picture.
What are the most impactful fixes for WordPress sites hosted on HighLevel?
Prioritize image optimization, minimizing render-blocking JS and CSS, enabling caching and CDN, and removing or deferring heavy third-party scripts. These typically yield the biggest gains in LCP and interactivity.
Can I automate performance monitoring and alerts in HighLevel?
Yes. Use HighLevel workflows to create tasks or alerts if you detect performance regressions. Include report fetches in recurring maintenance workflows to automate checks and client notifications.
What do the "immediately fix" and "consider fixing" categories mean?
"Immediately fix" indicates high-impact items that commonly reduce load time or interactivity. "Consider fixing" covers improvements with moderate impact or items that require more trade-off analysis. Use the two lists to prioritize quick wins first.
Where can I learn more or get help implementing fixes?
Refer to HighLevel help docs for WordPress performance guidance, join community resources like Nexus Hub for templates and implementation support, or start a HighLevel free trial to explore features hands-on.
Summary and Next Steps
The HighLevel WordPress performance report is a powerful, centralized tool for auditing and improving WordPress sites hosted on the platform. Use the report to identify Core Web Vitals issues, prioritize high-impact fixes from the page health section, and build a repeatable optimization workflow that fits your agency or maintenance process.
Next steps:
- Fetch a baseline report for any site you manage in HighLevel.
- Apply prioritized fixes in a staging environment, then re-run the report.
- Document improvements and integrate checks into monthly maintenance procedures or HighLevel workflows.
Start Your HighLevel Trial + Get Instant Nexus Hub Access
Build, scale, and optimize your business with HighLevel. Start a free trial using this link to get automatic access to the Nexus Hub community, templates, and implementation resources.
Start Free Trial